Dental Implant Clinic Performance Metrics in the United States (2023–2024)

Introduction
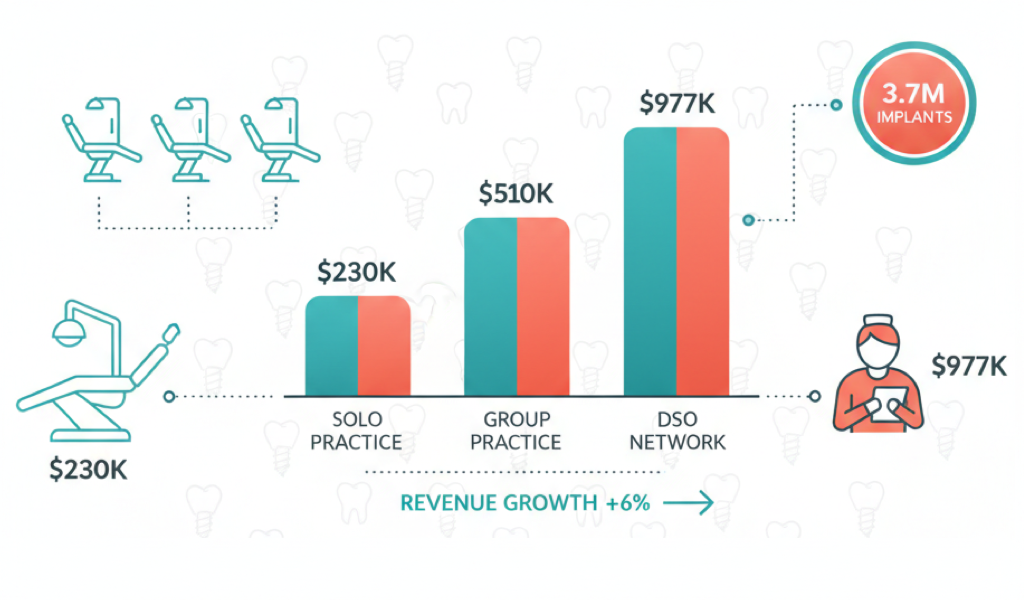
The dental implant market in the United States is experiencing significant growth, with millions of implants placed annually and an increasing number of practices—both private and corporate—offering these services. Industry estimates indicate that over 3.7 million implants were sold in 2022, with sales growing at an average rate of 6% annually since 2010. In this dynamic environment, understanding how to measure the performance of dental practices specializing in implantation has become increasingly important. This article examines key productivity metrics such as revenue per operatory, revenue per provider, and profit margins, providing benchmark data for different practice types—from small private offices to large multi-location groups—and exploring strategies that clinics are implementing to enhance operational efficiency.
Key Performance Indicators for Dental Practices
Revenue per Operatory
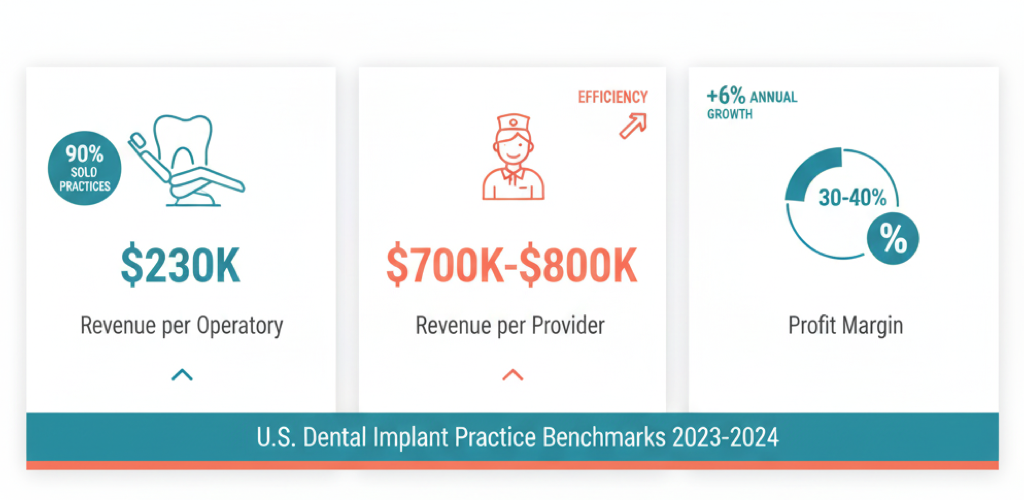
One of the most fundamental metrics is the annual revenue generated by each dental operatory (chair) in the practice. Across the United States, this figure averages approximately $232,000 per operatory annually. This represents the typical productivity level for a single treatment station: for instance, a private practice with 3–4 operatories generally generates between $700,000 and $900,000 in annual revenue. High-performing practices achieve substantially higher numbers—up to $300,000 per operatory or more—indicating excellent patient flow and efficient scheduling.
For practices focused on implant dentistry, where the average case value is significantly higher, revenue per operatory often exceeds these benchmarks, as each treatment station is utilized for more complex, higher-value procedures. Cosmetic and implant-focused practices, for example, can generate $1.5–2.5 million annually due to premium service offerings, translating to several hundred thousand dollars per operatory.
Revenue per Provider
This KPI measures the productivity of each dentist in the practice. According to 2023 survey data, the average total production per dentist (including hygiene revenue attributed to that provider) reached approximately $977,000 annually. When considering only the dentist's personal production (excluding hygienist contributions), the average drops to roughly $730,000 per year. These figures reflect typical performance for general practice dentists.
Implant specialists, however, typically achieve even higher productivity levels. Orthodontists and implantologists often generate $1.5–2 million in practice revenue per provider, driven by strong demand for their specialized services. Even general practitioners who incorporate implant services see marked improvements in their revenue metrics: offering advanced procedures such as implants and veneers increases the average revenue per patient and overall provider productivity compared to colleagues who refer these cases to specialists.
Profit Margins and Profitability
Profitability in dental practices is measured by operating margin—the percentage of revenue retained as profit. In the U.S. private dental sector, typical operating margins range from 30–40%, corresponding to average overhead expenses of approximately 60–70% of revenue. Put simply, practices retain about one-third of their income as profit before taxes. According to ADA data, the median overhead ratio is approximately 61.9%, leaving around 38% as profit.
High-performing practices maintain even stronger margins—a target net profit of 30% or higher is considered a hallmark of excellent financial health. It's worth noting that calculation methods vary: some analysts include the owner-dentist's compensation as part of profit, while others treat it as a salary expense. When the owner's salary is deducted from income, the average net margin for private practices drops to approximately 12–13%. Nevertheless, implant-focused practices generally enjoy strong profitability due to the premium nature of their services: adding implant dentistry to a practice's service mix typically increases the proportion of high-margin procedures in the overall revenue composition
Average Performance Metrics by Practice Type
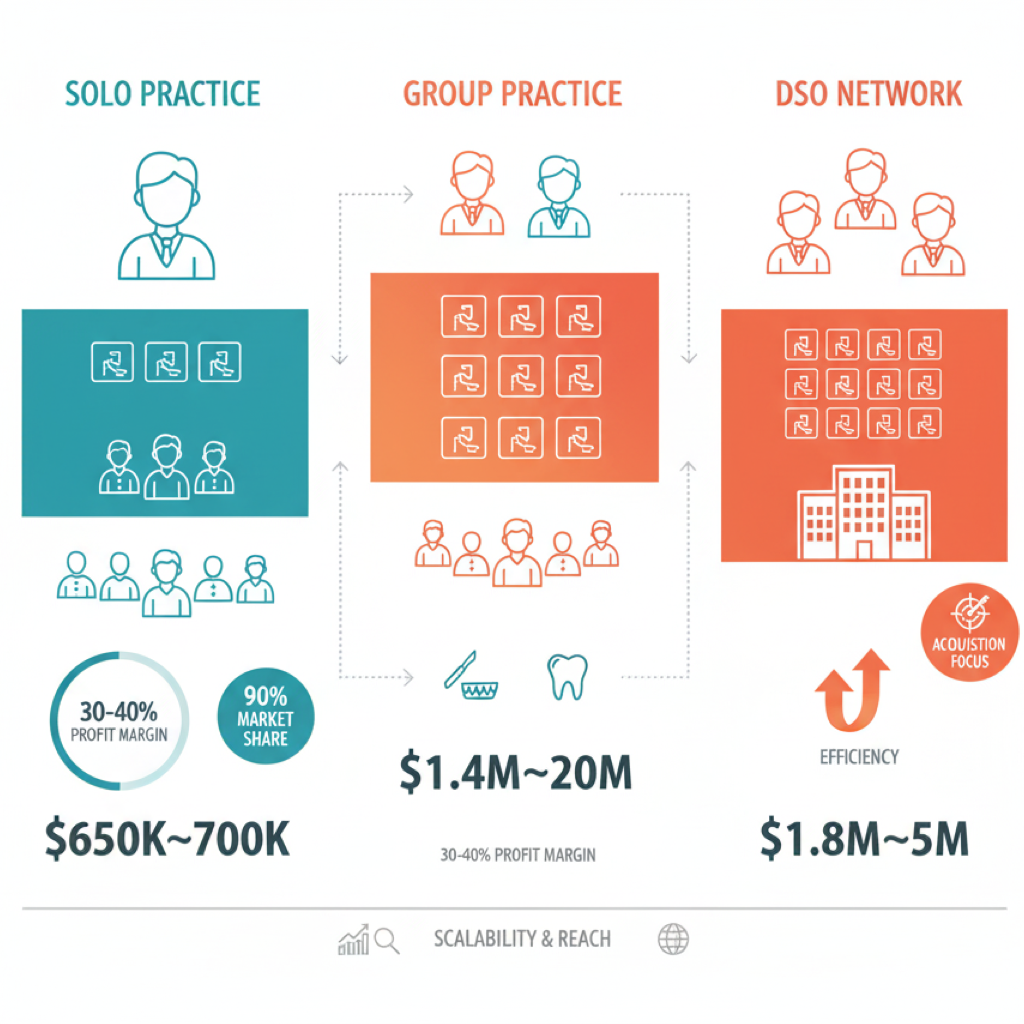
Small Private Practices (Solo Practitioners)
The majority of American dentists operate their own private solo practices—approximately 90% of dentists in the United States work independently. A typical solo practice structure includes 1 doctor, 2 assistants, 1–2 hygienists, and 2–3 administrative staff members, operating out of 2–4 operatories. The average annual revenue for a solo general practice is approximately $650,000–$700,000, or roughly $55,000–$60,000 per month. When calculated per operatory, this yields the industry-standard figure of approximately $230,000 per chair annually.
Profitability for these practices is generally healthy: about 30–40% remains as income for the owner-dentist (pre-tax), while net profit (after paying themselves a salary) typically falls within the 10–15% range. Adding implant services can significantly boost revenue even for solo practices: many private dentists pursue implant training, enabling them to increase the average case value per patient and overall practice revenue. As a result, successful solo practices with a focus on implants and aesthetics can approach $1–2 million in annual revenue, though such volumes are more commonly associated with group practices or networks. Overall, the typical "one-doctor office" in the United States represents a stable business model generating less than $1 million in revenue, occupying the niche of personalized care while reinvesting a portion of earnings into practice growth.
Group and Specialty Practices
This category includes smaller clinics employing multiple dentists or specialists that are not yet part of large corporate networks. Combining 2–3 doctors in one practice allows for substantial revenue growth, as production essentially multiplies with adequate patient flow. For example, if each provider generates approximately $700,000 annually, a two-doctor practice can produce roughly $1.4 million, and even more when specialists collaborate (such as a surgical implantologist working alongside a prosthodontist).
Industry data shows that specialty practices often operate at the $1–2 million+ annual revenue level. Orthodontic and pediatric practices average between $1 million and $2 million per year, while cosmetic and implant-focused centers frequently generate $1.5–2 million+ annually due to higher procedure costs. Smaller group practices typically have more operatories (5–8 chairs) and expanded staff. Revenue per operatory may remain close to the industry average (~$200,000–$250,000), but total revenue increases through economies of scale.
Interestingly, corporate networks seeking acquisitions often target these larger practices: DSOs typically look for clinics generating $800,000–$1 million+ with 5 or more operatories. This suggests that smaller groups have already achieved a level of efficiency and scale that makes them attractive acquisition targets. Profit margins for group practices are often comparable to solo practices (30–40%), though much depends on the specialty—orthodontists, for instance, may operate with margins of 50–60%. For implant-focused practices, expensive materials and laboratory work represent significant cost centers, but through volume and expense rationalization, even small-scale specialized implant centers maintain strong profitability.
Network Practices and Corporate DSOs
In recent years, large clinic networks organized by Dental Service Organizations (DSOs) or private equity groups have played an increasingly prominent role. Currently, 15–20% of American dentists work within the DSO model. Network implant centers (such as ClearChoice, Affordable Dentures & Implants, and others) and multi-practice groups (like Aspen Dental, Pacific Dental, Heartland, etc.) operate at an entirely different scale.
Typically, each clinic in a network is larger than a private practice, featuring multiple doctors, a dozen operatories, and extended operating hours. For example, leading DSO Heartland Dental had approximately 1,600 clinics and 2,400 doctors in 2022, with combined revenue of roughly $3 billion annually—averaging about $1.8 million per clinic. By 2025, Heartland expanded to approximately 1,800 offices and approached an estimated $5 billion in revenue (roughly $2.7 million per office). Another example: the Aspen Dental network (general practice but actively offering implants) had about 500 locations and annual revenue of approximately $645 million several years ago, averaging $1.3 million per clinic.
Specialized implant networks show particularly impressive results. ClearChoice, focused on comprehensive "full-arch" implant solutions, established 31 centers and achieved approximately $131 million in annual revenue within its first 4 years of operation (2019 data)—over $4 million per center on average. ClearChoice continued its expansion, and by 2025 estimates, the network (now part of the Aspen Group) generates approximately $600 million+ annually through several dozen implant centers nationwide. This means a typical network implant center produces several million dollars in annual revenue, far exceeding solo practice benchmarks.
The secret to network productivity lies in scale and standardization. First, a greater number of operatories and providers allows for significantly higher patient volume. For instance, when opening new clinics, Heartland designs facilities with 12 operatories and 2–3 dentists, noting that such locations quickly reach planned capacity. Second, scheduling: corporate practices often operate extended hours (evenings and weekends) and strive to minimize downtime, increasing production per operatory. Third, purchasing economies: networks leverage economies of scale—they purchase implants, materials, and equipment in bulk at significant discounts, reduce laboratory costs (often maintaining their own dental laboratories), and centralize administrative functions. This keeps overhead (rent, marketing, back-office expenses) within reasonable limits and allows maintenance of healthy margins even at high volumes.
Overall, DSO profitability is comparable to private practices: the industry demonstrates that after paying doctors and staff, networks can maintain approximately 30% profit margins, though a portion of this profit is then distributed to investors. It's worth noting that the rapid growth of networks has not yet fundamentally transformed the market structure—the private sector remains dominant—however, competition is intensifying, and network players are setting new efficiency benchmarks (million+ per clinic, hundreds of thousands per operatory) that forward-thinking private practices are striving to match.
Strategies for Enhancing Practice Efficiency
Modern dental practices—particularly those focused on high-value implant procedures—are actively implementing strategies to increase resource productivity (operatories, specialists) and financial performance. Below are the key approaches that have proven effective in 2023–2024:
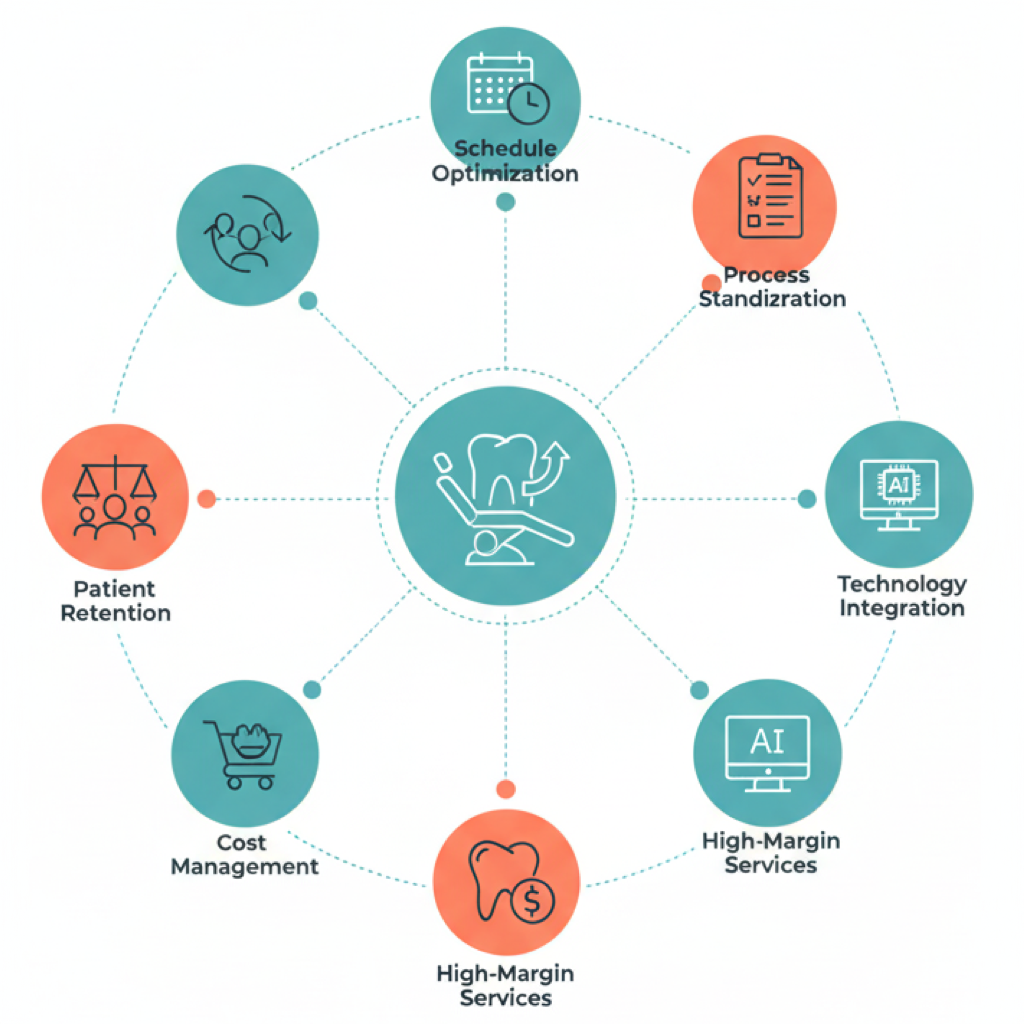
Maximizing Operatory Utilization and Schedule Optimization
Practices strive to minimize chair downtime through thoughtful appointment booking and confirmation systems. Modern scheduling methods include online appointment booking, automated reminders (SMS/email) sent one month, one week, and one day before appointments, and effective cancellation management. Many patients are placed on "waiting lists" and invited to fill newly available slots, helping to close scheduling gaps and maintain consistent treatment flow. Additionally, extended operating hours (evening shifts, Saturdays) enable practices to utilize operatories for more hours per week.
In large implant centers, doctors often work alongside staff anesthesiologists and assistants, allowing parallel use of multiple operatories (while one patient is being prepared, another is undergoing surgery, etc.). This approach significantly increases production per provider and per operatory.
Process Standardization and Staff Training
Improving operational efficiency is largely achieved through process unification and systematization. Leading practices develop detailed SOPs (standard operating procedures)—standards for executing all routine tasks, from insurance verification to sterilization protocols. Clearly defined and refined procedures reduce time and errors while ensuring consistently high-quality service regardless of shift or location.
Simultaneously, significant attention is devoted to staff recruitment and training: practices hire individuals with dental experience who require minimal on-the-job training. Regular training sessions, mentorship, and continuing education programs (especially within DSO networks) maintain high team productivity and enable service expansion. For example, Heartland Dental invests approximately 2.5% of revenue in training its doctors and assistants, considering this a key driver of efficiency growth. A well-coordinated, well-trained team can serve more patients per unit of time and achieve better conversion rates from consultations to treatment.

Implementation of Advanced Technologies
Technological investments are directly linked to practice productivity and profitability. Digital solutions enable faster, more accurate work with less effort. Examples include: CAD/CAM systems (such as Cerec) that allow same-day fabrication of crowns and implant surgical guides, reducing the number of visits; 3D cone beam CT scanners that enhance diagnostic accuracy and implant planning, reducing complication risks.
The latest trend is artificial intelligence (AI) in dentistry. AI tools already help automate routine operations (such as image processing, documentation completion, preliminary CT analysis) and accelerate administrative tasks (insurance claims, procedure coding). Industry experts estimate that AI implementation allows practices to "work smarter, not harder": automation reduces paperwork time, optimizes workflow, and identifies process bottlenecks. Technologies also improve patient experience—digital visualization of implant results increases trust and treatment plan acceptance rates.
The result is time savings and cost reduction, directly enhancing profitability. As industry reviews note, upgrading to modern digital standards makes practices more efficient and attractive: "integrated digital systems and AI diagnostics provide production gains and future readiness." Consequently, many practices have invested in equipment and software upgrades over the past 1–2 years, anticipating efficiency gains.
Service Expansion and Focus on High-Margin Procedures
The strategy of increasing revenue without proportional cost growth involves offering more high-return services. For general practices, this often means adopting implantology and related services (sinus lifts, bone grafting, implant-supported prosthetics). Data shows that adding implants and other "premium services" (such as clear aligners, veneers) substantially increases production per patient and overall practice revenue. Patients are willing to invest in smile improvement, and practices generate more revenue per visit.
Additionally, retaining patients "in-house" is a critical factor: if a practice performs implant surgery itself rather than referring patients to an outside surgeon, it retains both revenue and patient relationships. Many networks (including ClearChoice) are built around this "one-stop shop" concept: everything from tooth extraction to implant-supported prosthesis fabrication is done at one center. This saves patients time and provides practices with comprehensive revenue streams. Ultimately, a service diversification strategy not only attracts new patients (patients come for implants, stay for preventive care) but also increases the lifetime value of each patient, positively impacting business efficiency.
Cost Management and Economies of Scale
Enhancing efficiency involves not only revenue growth but also expense optimization. Large players demonstrate scale advantages: reduced unit costs through bulk purchasing of implants, materials, disposable instruments, etc. (suppliers offer networks significant discounts). Even smaller practices adopt this approach—forming purchasing cooperatives and negotiating bulk contracts with laboratories.
Control over major expense categories (payroll, laboratory and dental supplies, rent) is key to maintaining margins. Benchmarks recommend maintaining payroll at approximately 30% of revenue and material costs at 10–15%. For implant practices, particular attention is paid to laboratory and prosthetic work: some invest in in-house milling machines and 3D printers, fabricating prosthetic components internally, which reduces external costs and accelerates service delivery.
Over the past couple of years with rising prices (inflation), many practices have revised their budgets: 64% of practices reported increased overhead expenses in 2023, primarily due to salaries and materials. The response has been tightened cost control—from comparing supplier prices to eliminating waste and excess inventory. Some even implement incentive systems: for example, bonuses for purchasing managers who reduce expense ratios. Such measures help maintain profitability without compromising treatment quality.
Marketing, Service Excellence, and Patient Retention
Operatory efficiency largely depends on how fully those chairs are filled with patients. Therefore, practices actively work on patient attraction and retention. Strategies include: targeted implant advertising to attract new patients (especially online marketing to the 45+ demographic), partnerships with financing programs (nearly all implant centers partner with lending organizations, allowing patients to finance up to $50,000–$60,000 for complete prosthetic restoration), and building loyalty among current patients through quality service.
Patient retention is less expensive than acquiring new patients, and loyal patients provide stable revenue. Practices implement reminder systems for check-ups, follow-up calls after complex procedures, and satisfaction surveys. A high percentage of returning patients means predictable income and filled schedules without gaps. Service quality deserves special mention: minimizing wait times, clinic comfort, individualized patient care—all enhance conversion rates from consultations to actual cases.
From an implant business perspective, it's crucial that patients who come for an examination actually agree to treatment. Therefore, practices train staff in treatment plan presentation skills, use digital "before/after" visualizations, and showcase patient testimonials—all to increase case acceptance rates. Case acceptance metrics directly impact revenue: even a few percentage points of improvement significantly increases income with the same inquiry volume. Together, strategic marketing and patient-centricity keep operatories occupied, which enhances efficiency per provider and per operatory.
Conclusion
Over the past one to two years, American dental implant practices have actively measured and improved their efficiency metrics. Revenue per operatory and revenue per provider have become important indicators, enabling practices to compare their productivity against benchmarks (~$230,000 per operatory, ~$700,000–$800,000 per provider annually). Margins remain healthy despite rising expenses—approximately 30–40% profit from revenue is maintained through management efforts. Small private practices and large networks alike are seeking ways to become more efficient.
Current trends show that the key to success lies in strategic resource utilization: maximizing equipment and staff utilization, adopting new technologies, expanding profitable services, and maintaining strict cost control. These strategies enable U.S. market practices to grow revenue (including per operatory and per provider) without compromising treatment quality, maintaining high profitability and competitiveness in the rapidly growing dental implant segment.
Sources: Reports and analytics from 2022–2024 (Dental Economics, ADA, Pearl/Overjet), industry research and expert interviews, as well as examples from leading networks (Heartland, Aspen, ClearChoice). These open sources confirm the figures and trends presented. All statistical data is specific to the U.S. market.